
I have, on the wall of my office, a print of a Randall Munroe XKCD comic titled “Duty Calls.” It’s a guy who, in response to the question, “Are you coming to bed?” says, “I can’t. This is important…Someone is wrong on the Internet” (link). Randall may not know this, but that guy is me. So when Jeff Munroe (no relation), asked if I might poke around a bit to fact-check some claims, my response was simple, “I was born for this.”

Source: XKCD
Then I remembered I have a job and various other responsibilities.
But Jeff wasn’t asking for a dissertation-level, academic deep dive on any of these claims. He was just curious about the general consensus out there in data-land. A shallow dive, if you will. So, though my heart yearns for a few weeks of late-night surfing to explore all the complexities of each question raised, today’s shallow dive explores three claims that have popped up here in recent days.
*****
Claim 1: Children of progressive Christians give up on church more than children of conservative Christians.
One of the challenges in any sociological research involves defining our terms. When it comes to progressive versus conservative Christianity, one of the most common solutions involves comparing Mainline versus Evangelical churches. And, if we accept that transformation, the good news is that we do have that data. Ryan Burge, the go-to guru for all things religious, has answered this question in an article on religious retention rates (link).
Based on a series of national surveys, he concludes that, since the 1970s, religious retention—defined as “I am still affiliated with the same tradition in which I was raised”—has declined significantly for Mainliners (from 76 percent to 58 percent) and modestly for Evangelicals (78 percent to 73 percent).
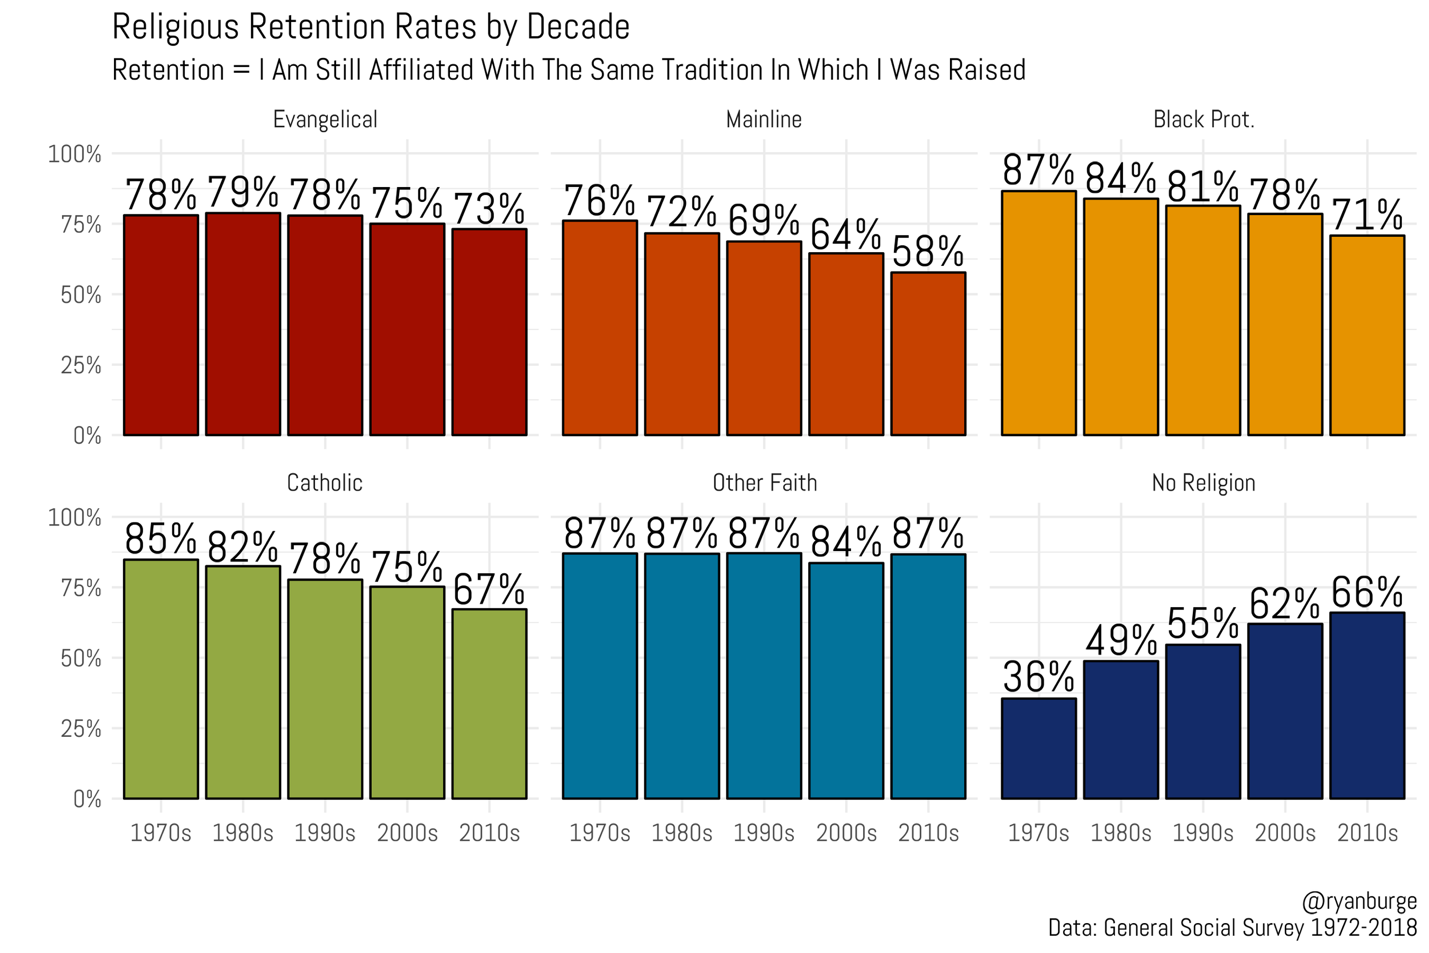
Source: Ryan Burge 2023
These data raise an interesting question: Where do these non-retaining kids end up? Are children of Mainline parents abandoning religious affiliation altogether? What happens to Evangelical kids who disaffiliate? Do all these kids turn their backs on religion? Burge again comes through with an interesting graphic that takes a little work to unpack.
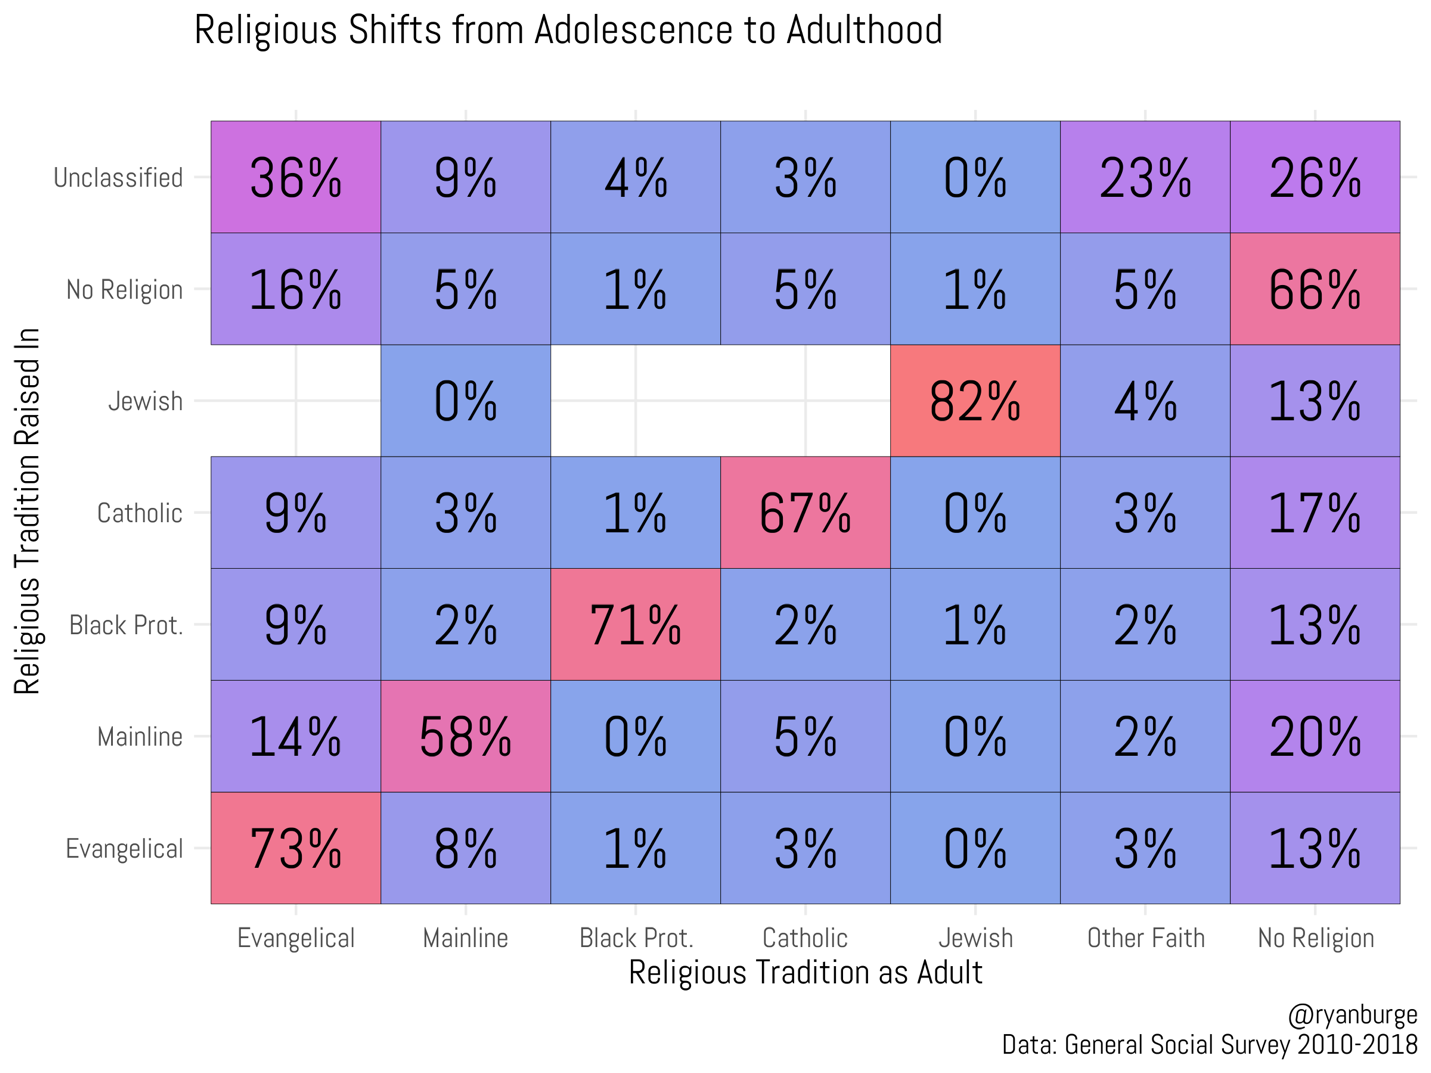
Source: Ryan Burge 2023
The easiest way to read these data is to pay attention to the intersections of rows and the columns. Because rows represent the “Religious Tradition Raised In,” start with them. To see where those kids end up, move through the columns for that row. Just use your finger to follow along: for those raised in the Evangelical tradition (bottom row), 73 percent remained in the Evangelical religious tradition as adults (left-most column); for those raised in the Mainline religious tradition (second row from the bottom), 58 percent remained in the Mainline religious tradition as adults (second column from the left).
Focusing first on the row for Evangelicals, we learn that 8 percent of these kids end up in Mainline churches as adults and 13 percent identify with no religion. Among Mainline kids, 14 percent turn to Evangelical churches and 20 percent become some version of Nones.
The challenge here is that these data only partially answer the question that was initially raised. I suspect that it is true that progressive Christians do not retain as well as kids in conservative Christians (a conclusion largely supported by Jesse Smith’s research), but that’s not what these data really measure. One way to see the limits of these data for that question is to ask, “What about Catholics?” They are Christians, but we don’t assume that they neatly fall into the conservative/liberal divide as a group. Along the same lines, there are liberal Evangelicals and conservative Mainliners. These data do not draw that distinction. On top of that, I continue to contemplate the correlation between education and religious participation: the higher your educational attainment, the more likely you are to religiously engage (link and link). What might that mean for long-term retention if there’s also a correlation between education and religious group identification? It would be possible to unpack these questions further by looking at data that takes religious and political ideology into account, the kind of thing I think Ryan Burge could do in his sleep, but I lack sufficient capacity to do that here.
Verdict: Mostly true. Probably.
*****
Claim 2: People on the left are more violent than people on the right.
This is the one that drew me into this data debate in the first place. I posted a response to a comment making this claim, which initiated Jeff’s question about what the facts might show. In my comment, I pointed to the following graph by Philip Bump (link):
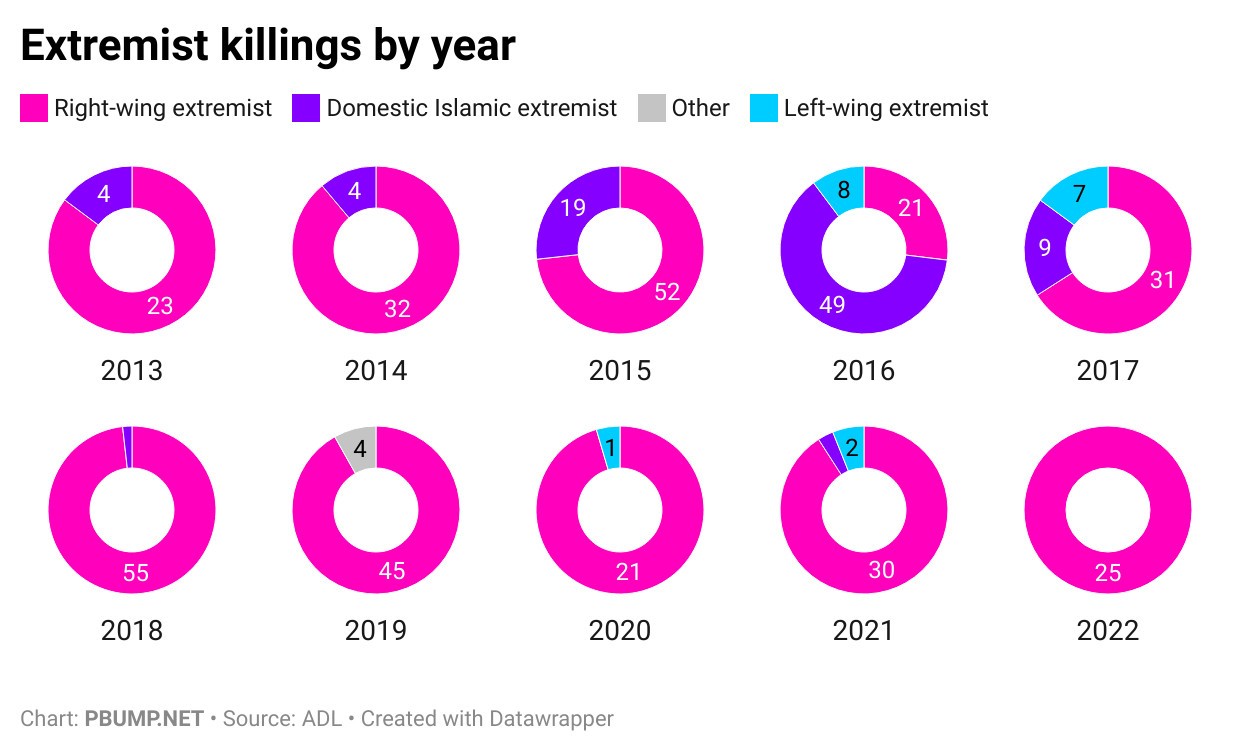
Source: Philip Bump 2025
The graph is based on data from ADL (Anti-Defamation League). Their report, Murder & Extremism in the United States in 2022 (link), provides a more complete description of the data, how it was defined, and what trends indicate. In their glossary entry on “right-wing extremism” (link) they define right-wing extremism this way: “In the United States, the extreme right consists primarily of white supremacist movements and anti-government extremist movements, but there are also single-issue right-wing extremist movements, or right-wing movements with an extremist wing, focusing on issues such as abortion or immigration.”
In Philip Bump’s post about this question (link), he includes additional links to other data, including a report from the National Institute of Justice, authored by criminal justice professor Steven Chermak and colleagues (archived link), which has since been taken down (link). In the opening paragraph, that report claims:
In fact, the number of far-right attacks continues to outpace all other types of terrorism and domestic violent extremism. Since 1990, far-right extremists have committed far more ideologically motivated homicides than far-left or radical Islamist extremists, including 227 events that took more than 520 lives. In this same period, far-left extremists committed 42 ideologically motivated attacks that took 78 lives.
In making that claim, the authors cite additional academic studies that support the same conclusion (see footnote 1). One of those pieces, “Far-Left versus Far-Right Fatal Violence” (link), found that, between 1990 and 2020, “Far-left homicide incidents accounted for 15.6% of these homicide events, and far-right homicides accounted for 84.4%.”
A similar conclusion is drawn in a study by the Center for Strategic & International Studies, “The Escalating Terrorism Problem in the United States” (link). The authors report (p. 1):
This analysis makes several arguments. First, far-right terrorism has significantly outpaced terrorism from other types of perpetrators, including from far-left networks and individuals inspired by the Islamic State and al-Qaeda. Right-wing attacks and plots account for the majority of all terrorist incidents in the United States since 1994, and the total number of right-wing attacks and plots has grown significantly during the past six years.
In support of their claim, they provide the following graph (p. 3):
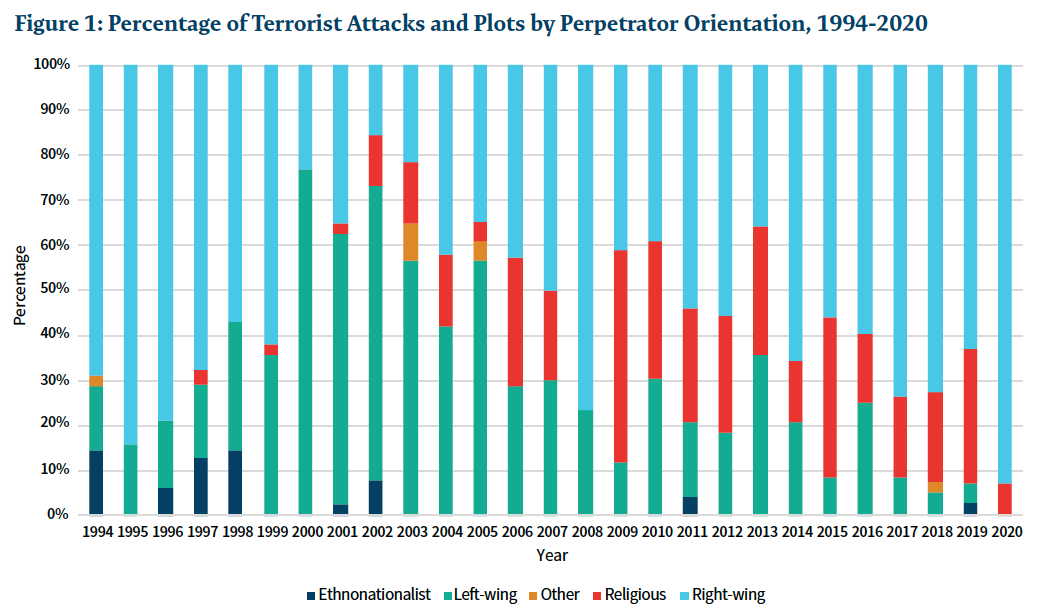
Source: Jones, Doxsee, and Harrington 2020
Represented here are 893 terrorist attacks and plots in the United States. Of these, 57 percent were perpetrated by right-wing terrorists, 25 percent by left-wing terrorists, 15 percent by religious terrorists, and 3 percent by ethnonationalists (p. 2).
Authors of a report last week in The Economist, “Is ‘Radical-Left’ Violence Really on the Rise in America?,” similarly pushed back on the claim that violence is more common on the left (paywalled link). They cite research analyzing felony criminal cases involving political violence from the Prosecution Project showing that “extremists on both left and right commit violence, although more incidents appear to come from right-leaning attackers” which is apparent in the graph they include with the article but which I am not able to reproduce here.
I just didn’t find reliable data that supported the claim of greater political violence from the left. The only way I could imagine that claim seeming true for some people would involve a substantial redefinition on their part of what counts as right versus left (e.g., redefining white supremacists as something other than right wing) and what counts as politically motivated violence (e.g., counting any violent crime committed by a presumed democrat as politically motivated).
Verdict: False.
*****
Claim 3: There are significantly more shooting incidents in the U.S. than in other countries.
To answer this one, I’m going to focus first on gun ownership and then on firearm homicides as an indicator of shooting incidents.
Americans love their guns. The United States is the only country where there are more guns than people. We see that represented in the following graphic:
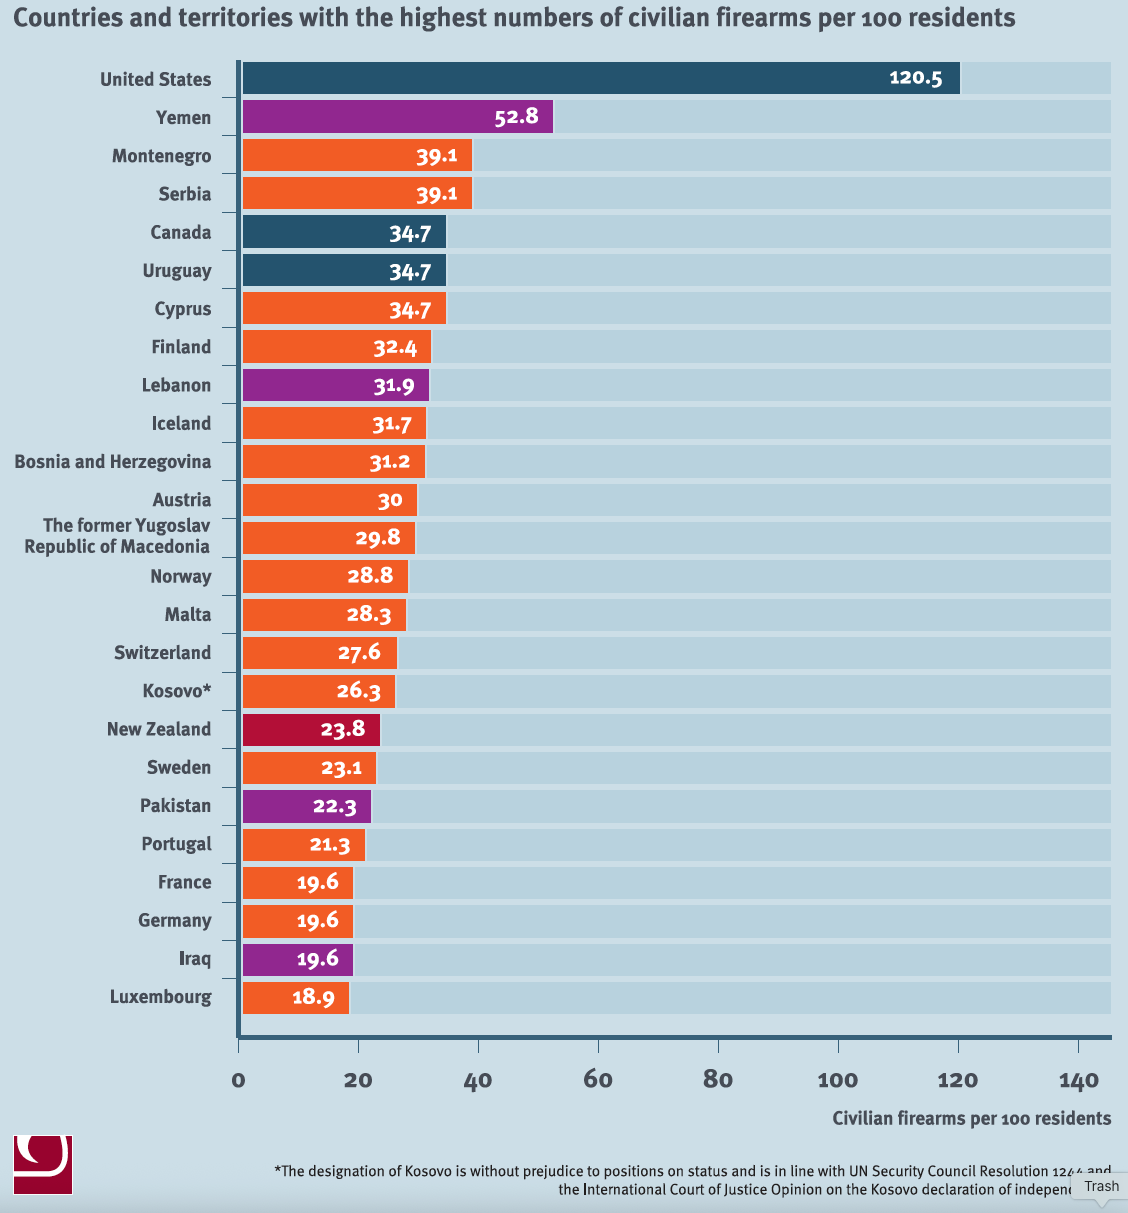
Source: Small Arms Survey. 2018.
According to a 2018 Small Arms Survey Briefing Paper, “American civilians owned 46% (approximately 393.3 million) of the worlds 857 million civilian-use firearms” (link & link).
As this map shows, gun ownership in the United States varies significantly by state:
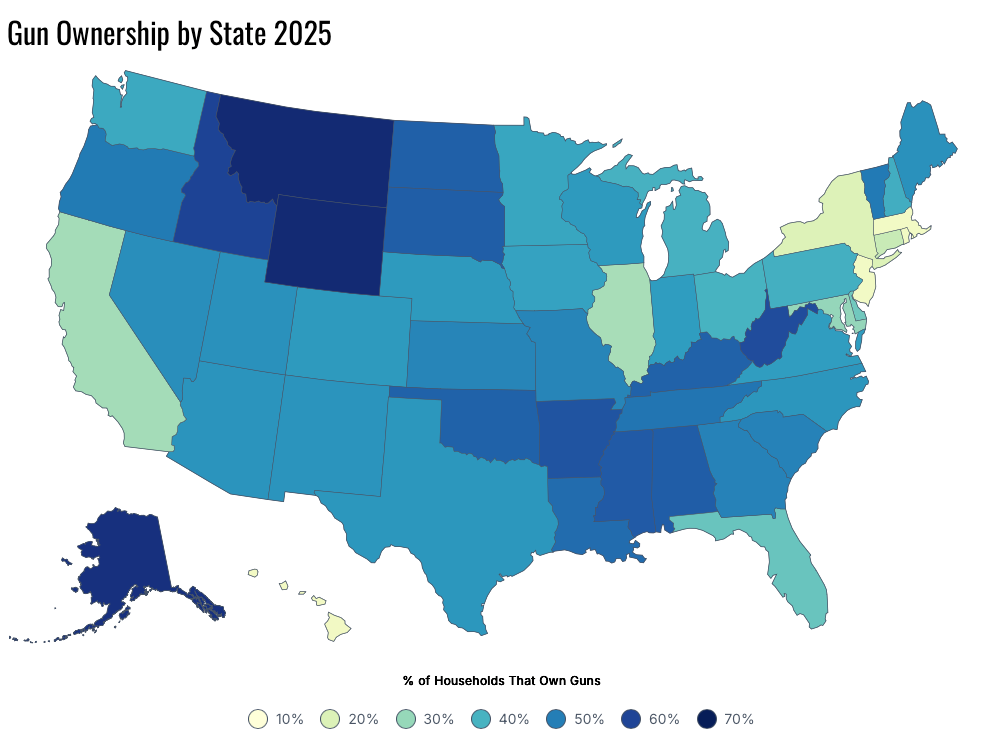
Source: World Population Review
Of course, owning guns and using them, especially in acts of violence are two very different things.
Gun death rates also vary by state. States such as California, Illinois, and New York have significantly lower gun death rates than states such as Louisiana, Mississippi, and Alabama.
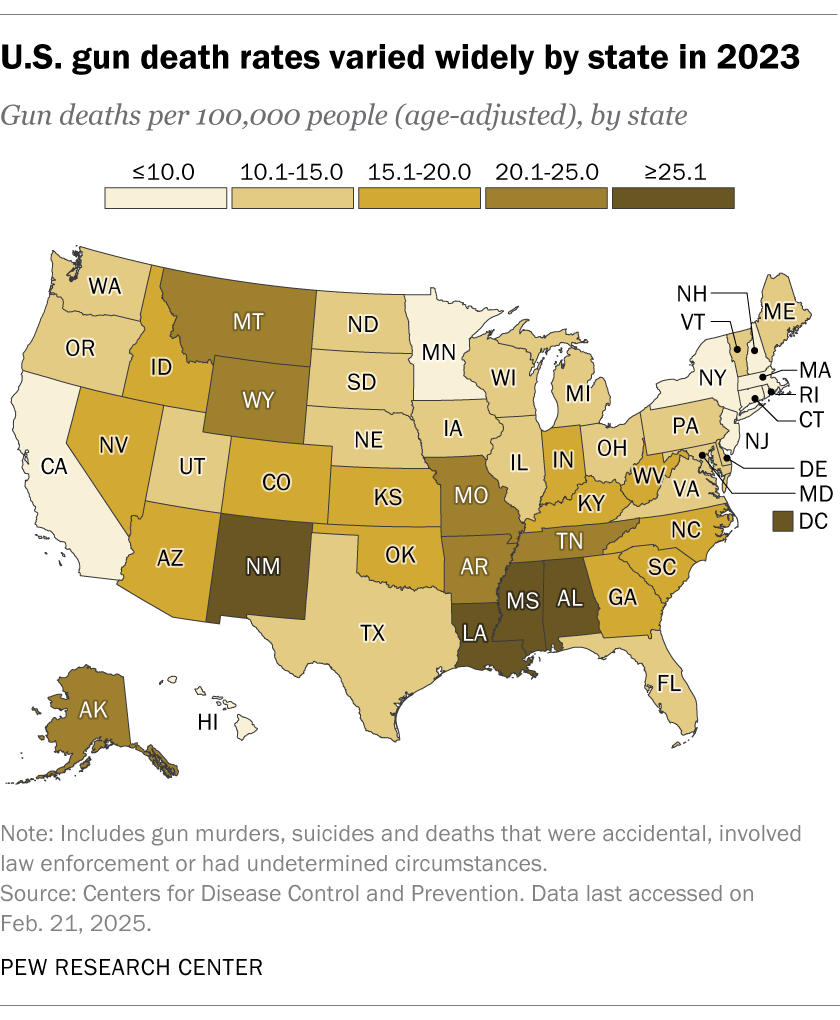
Source: Pew Research Center. 2025.
Since 1968, almost 1.9 million Americans have died from firearm-related incidents. Men made up about 84 percent of those deaths (link). In 2023, 46,728 people died from gun-related injuries (link).
Suicide accounts for 58 percent of gun-related deaths (link). Mass shootings receive substantial news coverage, but accounted for 1,399 deaths since 1966 (link). A total of 20,238 deaths were the result of police shootings over that same time (link).
Since 1979, firearms have been used in 79 percent of U.S. homicides (link). The United States does not have the highest firearm homicide rates in the world. As the following graph shows, there are six countries whose rates are higher, two of which, the United States Virgin Islands and Puerto Rico, are possessions of the United States:
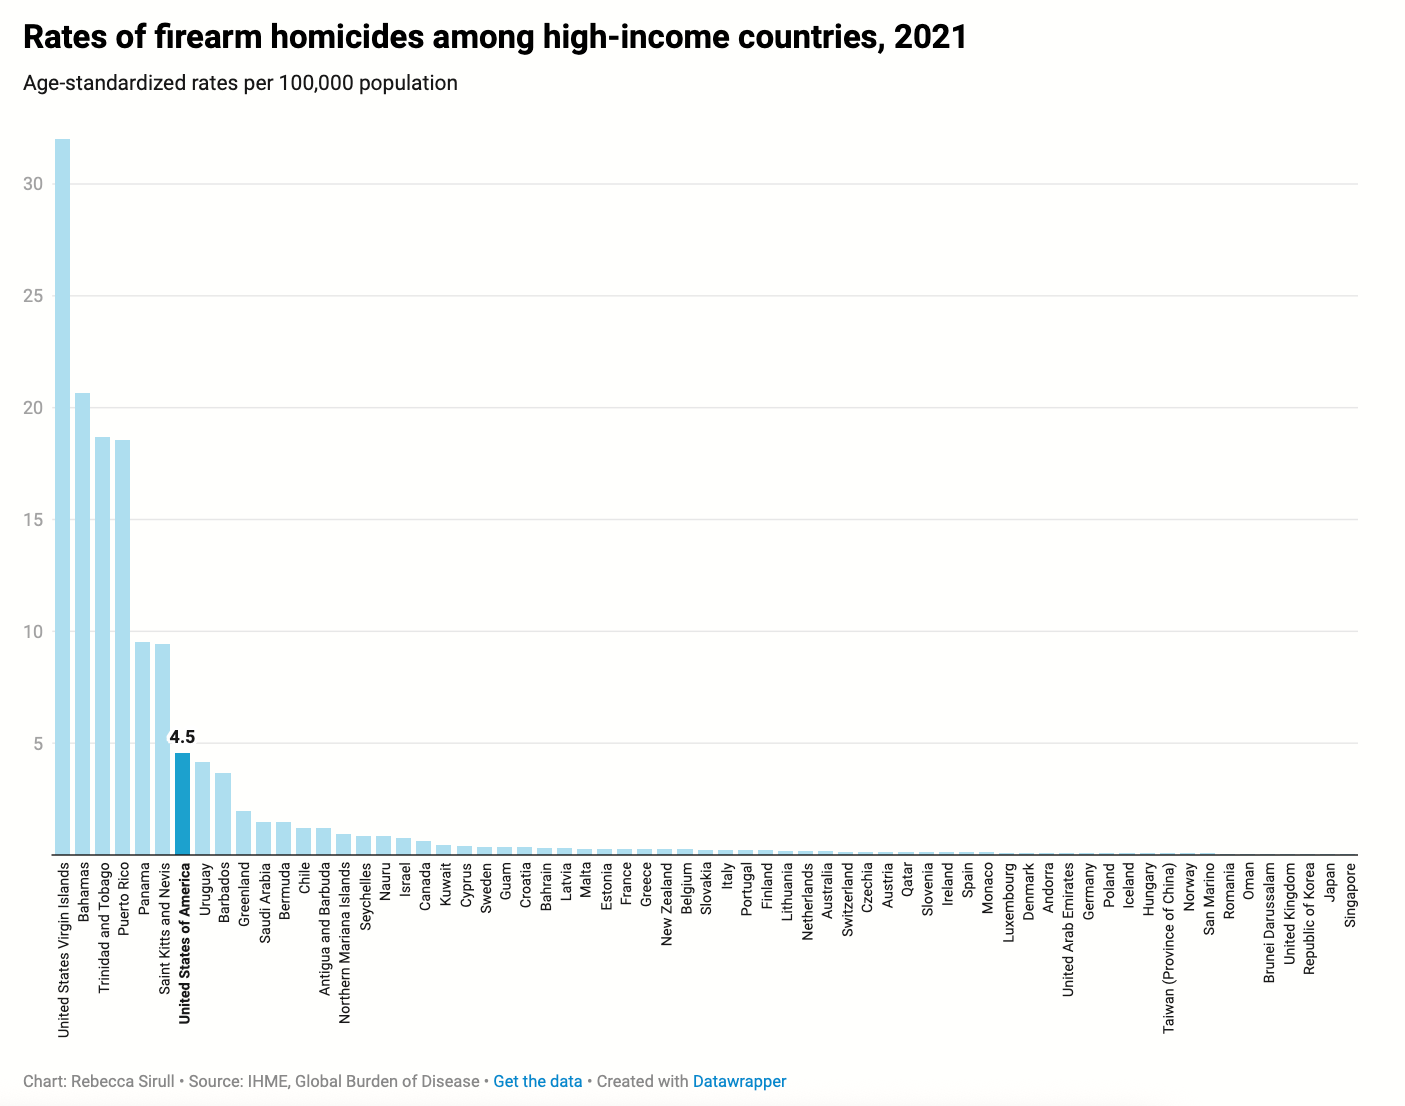
Source: The Commonwealth Fund. 2024.
The Commonwealth Fund reported that the United States ranks at the 93rd percentile for overall firearm mortality internationally (link).
According to a report published by KFF (Kaiser Family Foundation), firearms are the leading cause of death for children (link):
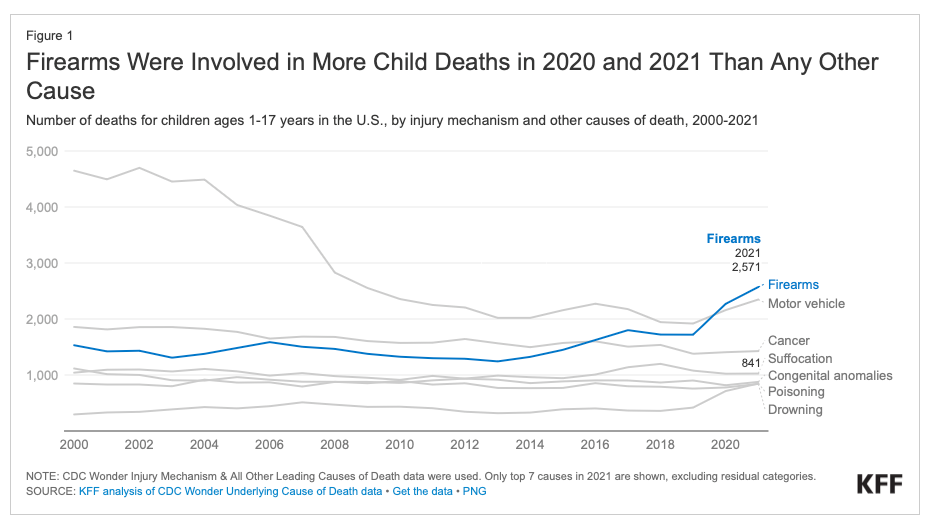
Source: KFF. 2023.
Verdict: Mostly true.
*****
Of course, any claim can be doubted and deconstructed. In scientific circles, that is to be expected. Doubt is the tool by which scientific knowledge advances. Certainty is the hobgoblin that tries scientist’s souls. I welcome links to data that might enhance our understanding.

14 Responses
Thanks for working on this. Unfortunately, many people will stick to their ideological views, regardless of the facts.
The onus would be on you, Jon or Mr. Bump to offer a cohesive definition of “right wing” that encompasses “white supremacists” or more specifically “white prison gangs”. I am reasonably confident these individuals do not identify with “right/left” North American politics any more than Black or Latino prison gangs do.
Each of these sources do provide such definitions. I provide links to all so that people can follow the ways in which they operationalize all their terms.
Of course they use this definition. The problem is it is self serving and highly misleading.
Thanks so much, Jon, for explaining and supporting the facts so well. As a 53-year teacher of mathematics and statistics I deeply appreciate your information and conclusions.
It is disconcerting (but not surprising) that so few readers responded with support of your (not so deep) important academic presentation.
Pleased that you can work with “some amazing students.”
Thanks! I appreciate the support.
I do feel lucky to work with students at Central College. It’s a dream job for me.
It’s always interesting to see just what claims are worth checking and just what claims go uninvestigated. I would offer to you that there many other claims in the OPs and comments here that are also worth thinking more carefully about. Of course, you did not intend to initiate a comprehensive review, for such would be too large a task. But the choice of claims that you looked at is telling, nonetheless.
These were the claims I was asked to explore. Sounds like you are suggesting bias. The data are the data. And it looks it looks to me like the presumed conservative-liberal scorecard is 1-2 on these claims. If you have some other claim you’d like explored, bring it.
“These were the claims I was asked to explore.” Indeed, my point exactly.
I’m not suggesting bias – such does not need to be suggested, as it is assumed and natural. To deny bias is to lie to oneself. Instead, I am providing a different perspective – something that tends to lack here at times. And in so doing I hope to prompt reflection – reflection that is good for all of us as we inhabit various conversation spaces.
It’s not for me to delineate the other claims that RJ authors and readers would do well to interrogate, but as an occasional fly in the ointment I do intend to spur each to inward thought about what some of those claims might be. And part of why I read here is to help myself do the same.
Your gun death rates chart includes suicide – which is another big consideration. I believe suicide accounts for about 60% of all gun deaths in the US. A good resource for how the church can address this huge problem is this presentation by Dr. Warren Kinghorn from Duke Divinity School and Duke University Medical Center.(I’ll provide the link at the end). He was at Calvin last February for the Symposium on Worship. He also addresses the issue of the states with the high prevalence of gun ownership, and notes that suicide is highest in those states with mostly white and native American populations (that also correspond often with those high rates of gun ownership). It’s very interesting and I believe another important layer to this conversation. https://worship.calvin.edu/resources/videos/we-are-all-here-worship-and-common-work-suicide-prevention
Thank you for this resource. It is very much appreciated.
If I can add a sociological aside, the first truly sociological study was a book by Emile Durkheim titled “Suicide.” He argued that biological and psychological explanations weren’t sufficient to explain likelihoods of death by suicide. He argued that lack of social integration was a major cause. People who are more socially integrated were significantly less likely to die by suicide. He focused on differences between Catholics (more integrated, he said) and Protestants (less integrated, more individualistic, etc.) and his data supported his hypothesis. It feels to me like we have a social integration crisis going on today and that, while it’s essential that we help people as individuals (counseling, prescriptions), we also need to work on building stronger social bonds in the contexts of communities. Religious organizations (e.g., churches, synagogues, mosques) are one place where such relationship building can occur.
Actually, Dr Kinghorn makes that same point about social integration, and notes that those states in the mountain regions of the US (from Montana and North Dakota down to New Mexico) where population is spread out and isolated have some of the highest suicide rates. He says it better than I just did, so I hope you can listen to him.
Really appreciate how this ‘Fact Checking’ piece digs into claims with care and nuance. Great work—makes me want to read more thoughtfully here
Here’s my thoughts based on limited but accurate research and a lifetime of noticing how things really are:
1. I agree with your conclusion. It seems like almost everyone on this site has at least one or two or all of their children that have abandoned the faith of their youth. But, in a way, so have their parents. This should induce some introspection. I haven’t seen that.
2. Your conclusion seems risible, but it’s been a busy week so I haven’t had time to refute your “data”. But here’s some information regarding the incredible bias of one of your sources:
https://thefederalist.com/2025/09/20/the-study-youre-citing-about-right-wing-violence-is-full-of-fake-data/
Similarly, using the ADL as a source is laughable. They are a political propaganda organization dressed as something else.
Anecdotally, be honest, in the last few years, can you really believe that there are anywhere near as many right wing high profile murders and violence as left wing? The “what-aboutists” on the left have all been referring to the Minnesota politicians who were killed recently, but even CNN does not attribute it to right wing motives.
If you’d like, we could play a game: I’ll give you $10 for every right wing political violent act you cite. You give me $10 for left wing act. Last 10 years are eligible. What do you say? Money goes to charity. I’ll donate to Turning Point USA, and you can give to, say, Minnesota Freedom Fund or Black Lives Matter.
2. You’re right. Lots of shootings. Lots of guns. The homicides are overwhelmingly committed by a very small subset of our population. If we could find solutions to the pathologies of that subset, the gun problems would decrease by orders of magnitude.
But, just like kids who abandon the faith in which they were raised, I don’t see much interest around here in changing the status quo.